According to Gartner, poor data quality could cost organizations up to $12.9 million annually. It has been predicted that by this year, 70% of organizations will track data quality metrics to reduce operational risks and costs. In fact, At Tiger Analytics, we’ve seen our customers embarking on their data observability journey by focusing on data quality checks retrofitted to their pre-existing data pipelines.
We’ve helped our customers leverage their homegrown data quality framework and integrate it with their existing data engineering pipelines to improve the quality of data. Here’s how we did it.
Investigating what contributes to poor data quality – A checklist.
In our experience, we’ve found that the common data quality issues are:
1. Duplicate data
Since the data is ingested from multiple data sources for downstream analytics, data duplication could easily take place.
2. Incomplete data
Key observations in a data set could be missed as the data goes through multiple levels of transformations before it can use used for analysis.
3. Incorrect data
Accurate data is vital for data analytics, incorrect data could be captured from the source due to wrong entries or human error.
4. Inconsistent data
During a database transaction, when the data is updated, it should reflect all the related data points, or else, data inconsistencies would occur.
5. Ambiguous data
Misleading column names, misspellings, and formatting errors could lead to ambiguous data.
The above data quality issues lead to data decay that significantly impacts the analysis and affects business operations, leading to a loss of revenue.
How to measure data quality
Here are a few questions we need to ask ourselves to determine the quality of our data.
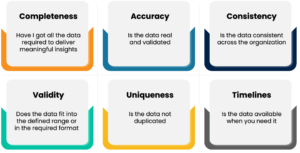
Manually measuring data quality against several of the above dimensions in a big data landscape could be time-consuming and resource-intensive. Detecting data quality issues manually is costly and will have a serious impact on business operations, so a scalable and automated data quality framework becomes all the more necessary.
The need for Automated Data Quality Monitoring
According to several studies [2], Data scientists seem to spend 30 to 60% of their time fixing data quality issues in the data preparation phase. This affects the productivity of data scientists who spend their time troubleshooting data quality issues instead of working on building models. So, investing in the right set of technology frameworks for automated data quality checks will play a vital role in Data Engineering pipelines to improve speed to market, operational efficiency, and data integrity.
We’ve built an MVP solution that has helped us quickly build a configurable metadata-driven framework by detecting data quality issues early in the value chain.
Tigers’ Automated Data Quality Framework – Technical Deep Dive
Following the Fail fast design principle, we at Tiger Analytics built an MVP solution that can quickly deliver business impact by detecting the data quality issues early in the value chain. The MVP strategy has helped us to quickly build a configurable metadata-driven framework, as shown below:
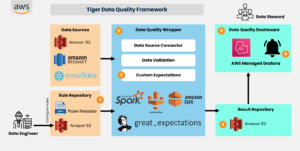
Tiger’s Data Quality Framework is built to detect data quality problems and notify the business via Data Quality Dashboards and notifications so that the business and data teams get better visibility on the health of the data.
The framework is built on top of the Great Expectations Library [3], and we have abstracted some of its functionalities and made it configurable and parametrized for the calling applications.
The framework has been built keeping in mind the following principles:
- Scalability – Scalable framework that can cater to a high number and variety of checks
- Configurability – A focus on a configuration-driven framework to eliminate the need for ongoing development as use cases increase
- Portability – Cloud agnostic and open-source tool set to ensure plug-and-play design
- Flexibility – Designed to leverage a common framework for a variety of technologies – Databricks, Queries, Files, S3, RDBMS, etc.
- Maintainability – Modular and metadata-driven framework for ease of maintenance
- Integration – Ability to integrate with existing pipelines or function independently in a decoupled fashion with ad hoc invocation or event-driven patterns
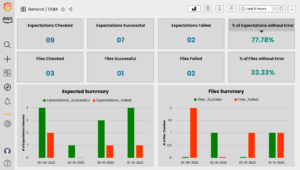
The framework helps us identify and fix issues in data and not let it propagate to other pipelines. Using a CI/CD workflow, rules can be added to the rule repository. The rule repository consists of user configurations such as source details, columns to verify, and exceptions to run. The framework uses Spark and Great Expectations under the hood to generate logic to validate datasets. The framework relies on Spark to filter rules from the rule repository and to read the source data. After which we leverage Great Expectations to validate data. The result, which is in JSON format, is written out to S3. The result is processed and summarized in a Data quality dashboard built using Amazon-managed Grafana, as shown below.
Tigers’ Automated Data Quality Framework – Custom Anomaly Detection Models
In a world of ever-growing data, data quality issues like inconsistent data, schema changes, and data drift have become more prevalent, affecting Data Science models’ performance and productivity. The use of statistical techniques could help detect outliers or anomalies. A handful of statistical DQ metrics to determine the anomalies are explained below:
In all the examples below, population data is the historical or archived data stored in the database, while sample data is the incremental or additional data generated. For easier understanding, all the examples mentioned below are with respect to the Retail Sales Data.
1. Suspicious volume indicator:
A moving average of data is calculated over the last quarter and compared with the actual data; if the data point is above or below the moving average by a threshold percentage, it is detected as an anomaly.
Example: If historical data is 10000 over the past x quarters, but the current data point is more than 12000 or less than 8000 (which is +/- 20% of 10000), then it is an anomaly. (With an assumption that the threshold is set to 20%)
2. Median absolute deviation (MAD):
The median absolute deviation of the data is calculated, and data points beyond +/- 3 standard deviations of median absolute deviation (MAD) are detected as anomalies.
Example: If the median revenue is 50 and Median Absolute Deviation (MAD) is 10 for the laundry category of sales data, then any data point greater than 80 (50 + 3*10) and lesser than 20 (50 – 3*10) would be detected as an anomaly
3.Inter-Quartile Range (IQR):
IQR is defined as the range between the 25th percentile (Q1) and 75th percentile (Q3) of the dataset.
Let’s consider revenue for the laundry category,
- The revenue data points which are below Q1 – 1.5 times IQR are considered anomalies
- The revenue data points which are above Q3 + 1.5 times IQR are considered anomalies
Example: If the revenue of the laundry category has an IQR of 20 (assume Q1 is 40 and Q3 is 60), then the revenue higher than 90 (60 + 1.5*20) and lower than 10 (40 – 1.5*20) would be detected as an anomaly.
4. Test of proportions (Independent Samples):
One sample Z-test:
To determine whether there is a significant difference between the population proportion and the proportion of data under observation.
Example: Historically, the revenue proportion of the laundry category in the month of January was 0.5. The latest data has a proportion of 0.6, so one sample z-test is performed to check whether there is any significant difference between the proportions.
Two sample Z-test (Independent Samples):
To test for significant differences between the proportions of two samples, or both the proportions are from the same populations.
Example: (Success/ Failure), (Yes/No), (A/B testing).
The proportion of the revenue for the laundry category is 0.2 when it is marketed through digital marketing and 0.17 when in-store, so a z-test for two proportions is used to check for significant differences between the two marketing types.
5. Repeated measures of ANOVA (Dependent Samples):
To check whether there is any significant difference between more than two sample means of the same subjects under consideration over time. This test would let us know whether all the means are the same or at least one mean is different from the other means.
Example: Let’s consider the revenue of the laundry, cooktop, and refrigerator categories over the month of January, February, and March individually. The repeated measure of ANOVA will test for any significant difference between the revenues of the above-mentioned categories over the period.
6. Signed Rank test – Wilcoxon Signed rank test:
It’s a repeated measures test/ test of related samples. For one sample, it’s an independent test, and for the two-sample data, it compares the data under observation under different conditions for the same subjects and checks whether there is a significant difference between them. This helps in evaluating the time course effect.
Examples: To test for any significant difference between the revenue of the refrigerator category in the months of winter and summer seasons, a signed rank test is used.
7. Shift indicator:
a. Benford Law/Law of first numbers:
The pre-defined theoretical percentage distribution of the first digits in Benford law is compared against the percentage of the first digits of data under observation, and if it’s beyond a certain percentage threshold, then it’s detected as an anomaly.
Example: Pre-defined theoretical percentage distribution of digit 9 in Benford’s law or the law of first numbers is 4.6%, and if the first digit percentage distribution of digit 9 for the revenue of the laundry category over the month of January is 6%, then it’s an anomaly. (Assume the threshold is set to 10%)
b. Kolmogorov-Smirnov (KS) test – One sample:
Theoretical Benford percentage distribution is compared with the first digit percentage of data under observation. The confidence interval is defined to check whether there is a significant difference between the distributions.
Example: Consider the revenue data for the refrigerator category for the month of January. The percentage distribution of the first digit (1-9) of the revenue data is compared with the Benford law’s theoretical distribution. If there is any significant difference between them, then it’s an anomaly.
c. Kolmogorov-Smirnov (KS) test – Two samples:
In KS two-sample test, the first digit percentage distribution of two samples under observation is compared to check for significant differences between them.
Example: Consider the revenue data for the refrigerator category for the month of January and February. The percentage distribution of the first digits (0-9) for revenue data for the months of January and February are compared, and if any significant difference is observed, then it’s an anomaly.
8. Quantile-Quantile (Q-Q) plot (Graphical Approach):
This approach checks whether the data under observation follows the intended theoretical distribution (Gaussian, Poisson, Uniform, Exponential, etc.) or whether the data is skewed. It also helps in identifying the outliers.
Example: Plotting revenue data for the month of January to check for any outliers and data distribution.
9. Correspondence analysis (Graphical Approach):
Correspondence analysis helps in identifying the relative association between and within two groups based on their variables or attributes.
Examples: Refrigerators of brands A, B, and C will have certain attributes associated with them such as price, quality, warranty, after-sales service, and rating. The correspondence analysis will help in identifying the relative association between these two refrigerators based on the above-mentioned attributes.
Summary
Accurate data is the key to businesses making the right decisions. To set the data quality right, business leaders must meticulously define the data quality objectives and processes to profile, detect and fix data quality issues early in the BI value chain to improve operational efficiency. IT leaders must work on detailed data quality strategies, solutions, and technology to meet business objectives.
By taking an automated approach to data quality using the Tiger Data Quality framework, data platform teams can avoid the time-consuming processes of manual data quality checks. This can bring the following outcomes to the business:
- Improves confidence in making effective decisions from good data
- Improves customer experience
- Reduces the cost of detecting and fixing data quality issues much late in the value chain
- Improves productivity for data engineers, and data scientists who can focus on solving business problems over debugging data quality issues
- Improves data compliance
Sources
https://www.gartner.com/smarterwithgartner/how-to-improve-your-data-quality