Author: Ajith Raam D
Agrochemical companies manufacture a range of offerings for yield maximization, pest resistance, hardiness, water quality, and availability, and other challenges facing farmers. These companies need to measure the efficacy of their products in real-world conditions, not just controlled experimental environments. Single-crop farms are divided into plots and a specific intervention performed in each. For example, hybrid seeds are sown in one plot while another is treated with fertilizers, and so on. The relative performance of each treatment is assessed by tracking the health of the plants in the plot where that treatment was administered.
The industry-standard measure of plant health is the Leaf Area Index (LAI), which serves as a measure in thousands of studies of vegetation (cultivated and natural), climate, and the environment. It is the basis of most agronomical and horticultural studies that examine fertilizer and irrigation efficiency, among many other applications. The LAI is an important indicator of radiation and precipitation interception; energy conversion; water balance; and ultimately plant growth. The relationship between LAI, number of leaves per plant, and crop yield is complex, varying with the type of crop and the life stages of the individual plants.
Traditional LAI measurement is time-consuming and difficult: leaves must be collected either by harvesting or by picking up leaf litter. Individual leaves must be straightened and smoothened out and measured painstakingly at various points along their length. This tedious, expensive process invariably means that measurements are infrequent; made on small, controlled areas; and in insufficient quantities to either build models or train models properly.
Agrochemical companies are already experimenting with advanced data science techniques to overcome these challenges: they employ drones to capture high-resolution aerial images of the farms and apply computer vision techniques and other complex algorithms to process the images. However, challenges persist; leaf characteristics such as orientation, alignment, length, shape, and twists are difficult to discern when viewed from above, particularly in crops that grow tall and narrow, such as maize. Further complexities are introduced by variability in ambient light conditions, soil terrain, cloud refraction, occlusion, and other environmental factors. Finally, all these factors vary over time, which means that to get a clear picture of plant health and treatment performance, regular measurement is required.
As deep learning and computer vision fields mature, scientists are beginning to use these technologies for such LAI measurements, and more. Tiger Analytics has collaborated with leading Agrochemical companies to develop such solutions. In this article, we outline the possible approaches and challenges.
The primary challenge in developing a deep learning solution is the near nonexistence of training data. Acquiring enough data to train the network sufficiently would take several months of manual leaf measurement and huge resource deployment. To get around this, a completely synthesized data set is created: both the model source and training data are manufactured, and the ‘real’ data (which, as described previously, is extremely limited and obtained only infrequently) is reserved for the final validation.
Preparing the data set mandates working closely with agricultural scientists and botanists, and taking full advantage of their extensive knowledge to sift through the drone images and curate leaf profiles. Each leaf profile is then divided into cross-sections and the width, twist, and color saturation simulated for each cross-section. Random variations are introduced in leaf widths, distributions twists, the number of leaves on a plant, plant age, direction of growth, and other parameters, again by applying botanical expertise.
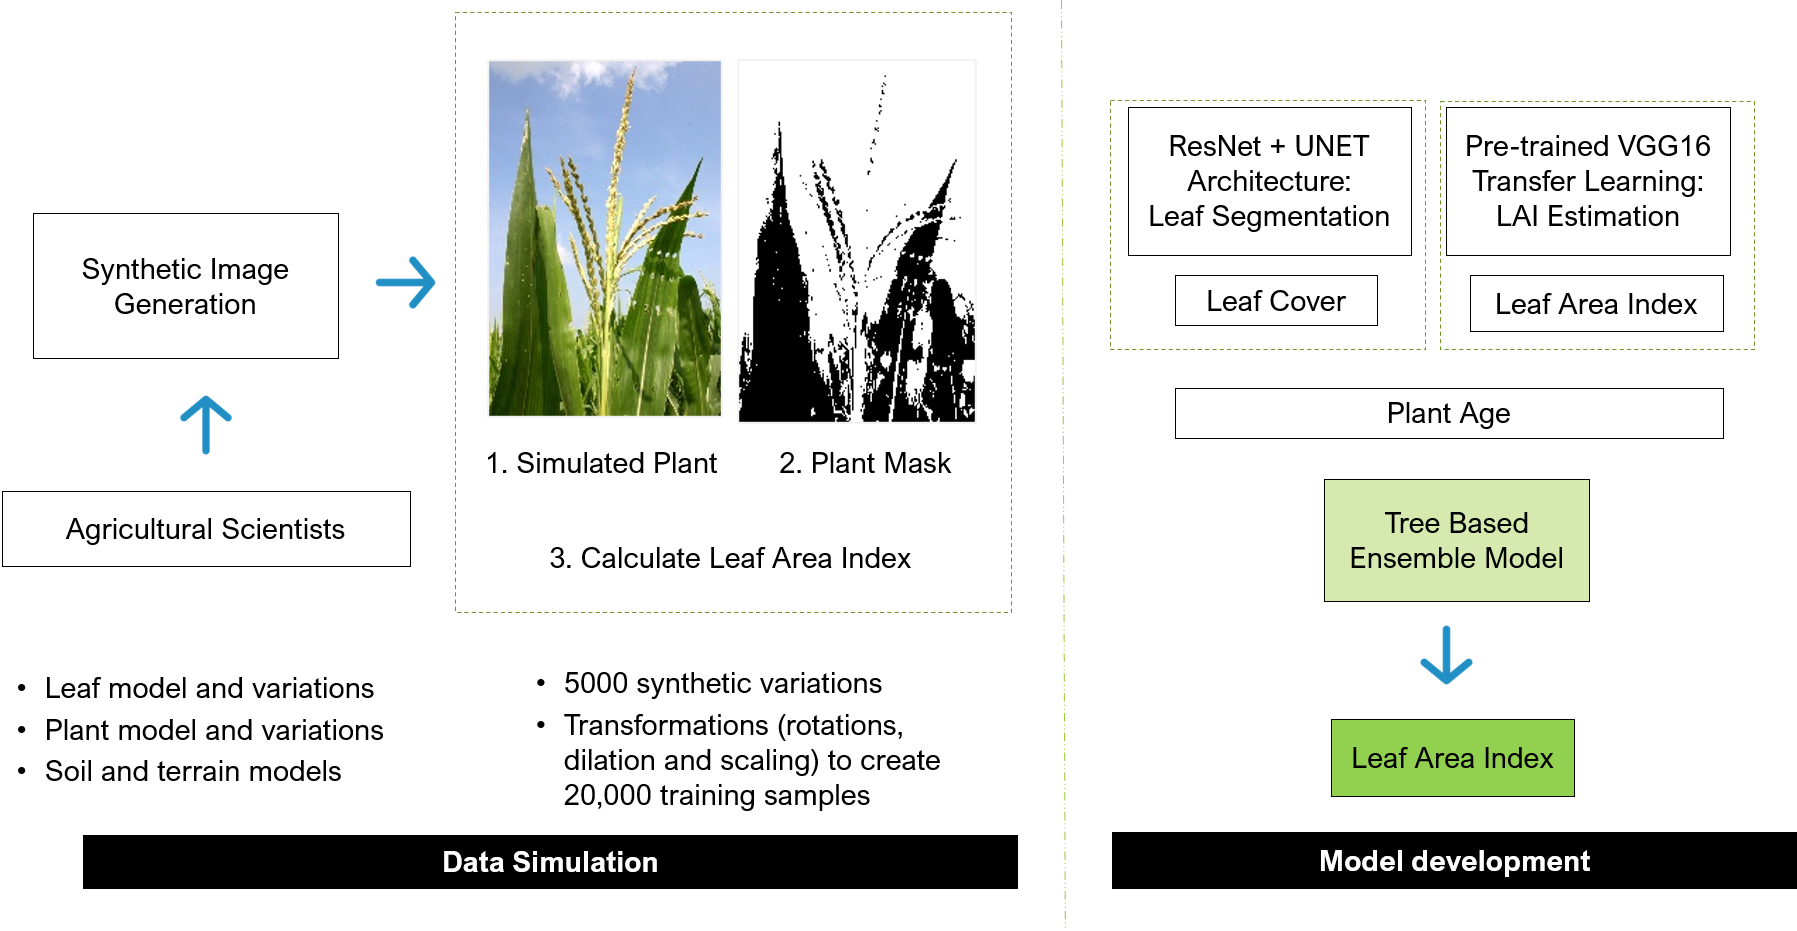
A random selection of these individual simulated plants is placed in rows as in a typical field. Ground soil texture and color are simulated using a variety of texture models. These actions are repeated for multiple farm layouts, and numerous perspective views are captured. The ground truth is computed from these simulated farms to obtain the first set of LAI estimates.
To train the network, input simulated perspective images are used, with losses computed using the mask and LAI from the simulation process. Training two networks is beneficial. The first network creates a segmentation mask that captures the leaf cover area from the drone image, used to calculate the LAI. The second network directly estimates the LAI from the image; this network without any segmentation. The former performs well on younger plants while the latter does better on older plants. The two networks are refined separately using model changes and training data biases. Results from the two networks, ensembled via boosted trees, are used to get the final LAI estimate.
The Tiger Analytics process described above deals with maize farms, which, when monitored weekly, engender approximately 500 image patches per week. This is a bare-bones solution to model LAI for effective local monitoring. Pytorch was used to develop the deep learning models, XGB the ensemble, and Python the pipeline to batch-process the drone images and calculate the LAIs.
Fine-tuned deep learning approaches, when compared to computer vision approaches, cut down the mean absolute error by half. Model variations in architecture, training data, mechanisms, and forms are typical in deep learning projects, but the near nonexistence of ground truth data is a unique challenge. Overcoming it requires a very close partnership between plant scientists and data scientists to develop a synthesized data set that mimics the true field environment in sufficient detail but contains enough generalization and randomness so as to avoid overfitting.
Building a network on synthesized data and having it perform reliably on real-world scenarios mandates critical examination of neural weights. It is an iterative process in which each interim result must be studied in consultation with plant scientists to explain which types of images the model performs poorly on and why, and those learnings incorporated into subsequent training syntheses.
Varying farm geographies, sizes, crop mixes, species specificities, environmental parameters, and monitoring frequencies, will all need to be accounted for as agrochemical companies study their products’ efficacy. Sensors in plant beds monitoring moisture, soil, radiation, temperature, and other variables, will only add to the complexity.
This solution demonstrates that effective deep learning models are possible using synthetic data but needs substantial collaboration with botanists. Domain expertise, context, and circumstantial understanding ensure that the synthesized data set is generalizable enough to make the model robust and resilient.
This article was first published in Analytics India Magazine- https://analyticsindiamag.com/measuring-crop-health-using-deep-learning-notes-from-tiger-analytics/