Authors: Harini Shekar, Nivas Athimoolam
Consumers expect products to be on the shelf when they need them. Approximately 49% of customers choose same or next day delivery in online shopping. If physical stores want to retain customers, ensuring on-shelf availability of the needed product is the key. It is one of the most significant changes in consumer expectations in recent years.
Walmart estimated that poor in-full (availability) performance accounted for $1.7 billion in lost sales during the 2018 fiscal year. Physical stores need to maximize revenue out of their finite shelf space. For these physical stores, continuously replenishing their assortment based on what is selling and what is not depends not just on having the needed inventory in the back of the store but also on the absence of wasted effort in handling materials that are not required.
As mentioned above, when there is an absence of effort for the materials that are not required, the store’s primary purpose is to capture demand and deliver the largest selection of needed products.
All this boils down to—Having the RIGHT QUANTITY at the RIGHT TIME on the shelf space.
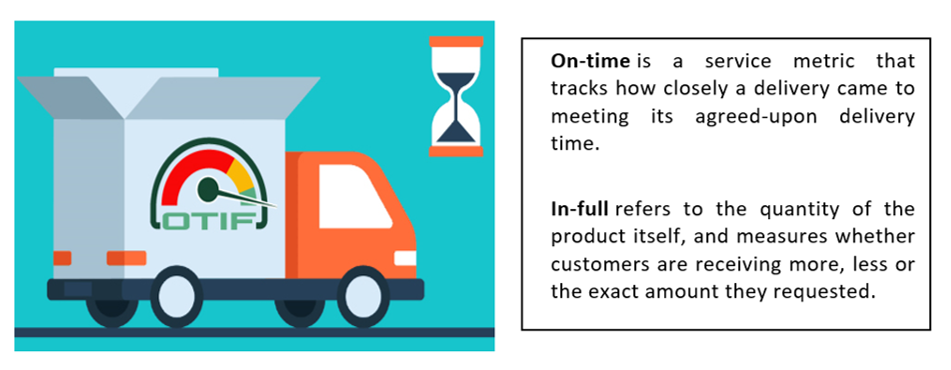
What is OTIF?
There are several ways to measure order delivery performance. While Walmart may have created the OTIF (On Time In Full) delivery requirement, the Standardized OTIF metric is still confusing. Every supply chain stakeholder had their own interpretation—“Does on-time mean the date requested by the retailer or the date promised by the manufacturer? Does it mean within the specific delivery slot allocated to the shipment or any time inside a broader, agreed-upon time window? Should ‘in-full’ be measured at the level of complete orders, line items, or individual cases?”
A McKinsey and Trading Partner Alliance (TPA) survey of 24 major U.S.-based retailers and manufacturers of consumer packaged goods states that a single metric to measure both on-time and in-full was desirable compared to measuring each component separately.
Additionally, 79% of respondents said they prefer to define in-full at the case rather than the order or line level. About 67% of respondents said they prefer to define on-time as the requested delivery date or the must arrive by date rather than the scheduled delivery appointment date or the manufacturer’s committed delivery date.
The answer is OTIF. It is one metric with two different components combined into it:
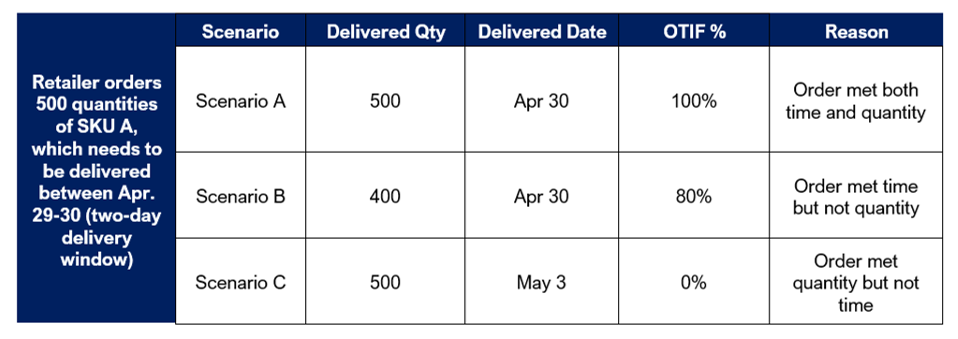
OTIF is calculated based on the delivered quantity and the delivered date. An illustration of the OTIF % calculation is shown below.
To meet the consumer demands on time and maximize revenue, Walmart imposed the OTIF (On time In Full) metric in 2016 with a penalty for non-compliance as three percent of order value. In addition, early and late deliveries are penalized within a few days of the delivery window.
Why does OTIF matter to CPG companies?
OTIF is a compliance program designed to ensure that products are on the shelf when they need to be and where they need to be. Orders arrive by the time and the day listed on the purchase orders. The OTIF metric offers a clear incentive for the CPG companies to raise their score and ensure their ability to meet the expected demand.
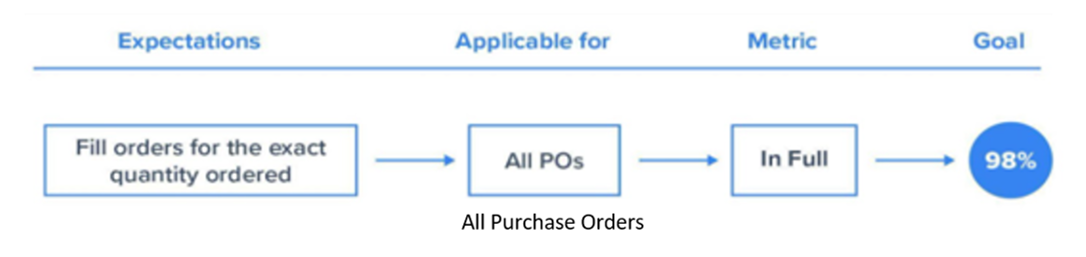
Walmart’s monthly goals for OTIF suppliers are as follows:
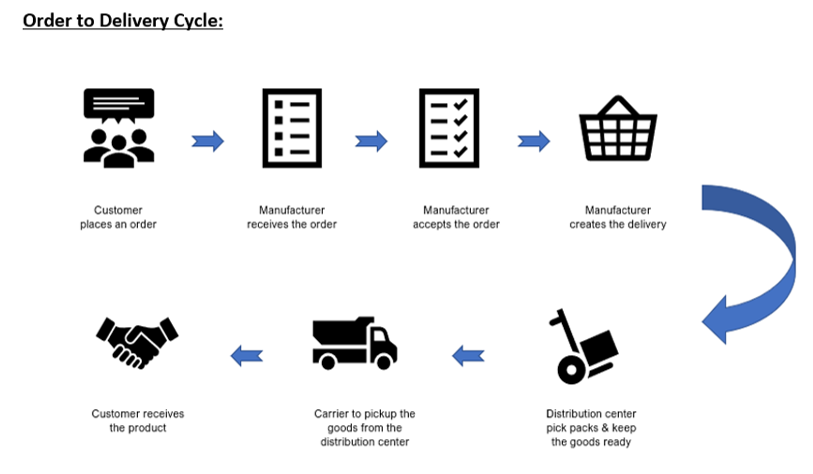
The supply chains for CPG companies that fail to achieve their OTIF goals may face hefty penalties based on the cost of the goods sold. Earlier, the supply chain used to end with the Distribution Centres (DC) serving the physical stores’ DCs. As a result, the CPG companies did not have a clear view of end-consumer demand, as they had to rely on syndicated data. Now, retailers are passing the end-consumer demand at the stores to the CPG companies. The CPG companies will have to use this data to focus on forecasting the end-consumer demand more accurately. This loss of inventory is a challenge for the CPG companies unless predicted correctly.
How can root causing and AI help improve OTIF based on Tiger’s experience?
Industry reports show that on-time delivery motivates 72% of customers to repeat purchases from the same seller. The most crucial step towards achieving on-time delivery metrics involves solving operational issues at the grassroots level.
One of the largest supply chain and manufacturing clients for Tiger Analytics had issues with achieving the OTIF metric across different customers. In addition to tracking the ongoing OTIF, they were also interested in understanding the root causes behind these OTIF misses. A real-time dashboard was built, which enabled the customer management teams to view the weekly OTIF metric and the root causes behind OTIF misses. Specific actions against these root causes enabled the client to improve the OTIF metric by a significant percentage.
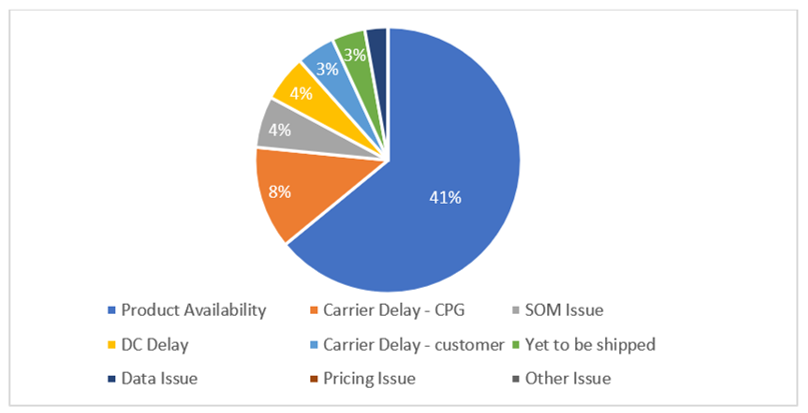
From the above chart, it can be seen that product availability seemed to be causing most of the OTIF misses. This could be due to the product’s unavailability due to lower safety stock, higher forecast bias, or raw material availability.
Carrier delays could either be caused due to customer carriers or the company’s in-house carriers. This seems to be the second-largest contributor of OTIF misses, followed by Sales Order Management (SOM) related issues and delays caused by Distribution Centers (due to the production capacity, labor constraints, production line failures, etc.). Although these root causes enable planners to retrospect and understand the causes behind OTIF misses, AI and advanced analytics were needed to predict the root causes and enable preventive action proactively. The below set of analytical capabilities were implemented across each supply chain area to improve the OTIF metric.
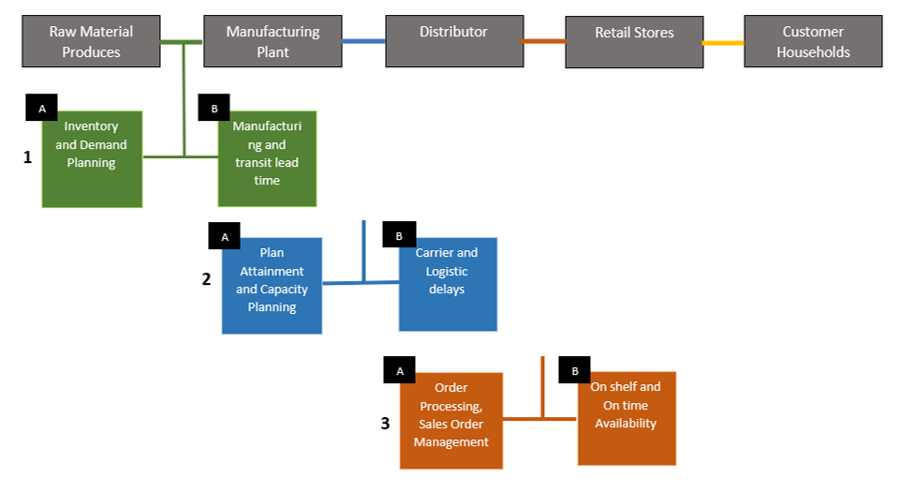
1 A. Inventory and demand planning model:
Determining optimal inventory levels to satisfy demand while minimizing stock leveraging predictive analytics allows supply chain managers to determine detailed inventory requirements by region, location, and usage.
In turn, an accurate demand forecast provides vital information for driving the desired raw material, WIP, and finished goods inventory levels. This reduces the Bullwhip effect across the supply chain, leading to optimization of inventory levels and reduction in stock-out or over-stocking situations.
1 B. Predicting manufacturing and transit lead time:
Accurate prediction of how long it would take to manufacture and transit a specific product has a big influence on the on-time delivery of the product. Leveraging historical data to predict the manufacturing and transit lead times based on various factors such as type of SKU, manufacturing DC, customer, region, etc., enables the business to estimate the delivery date for the product.
2 A. Plan attainment and capacity planning:
Both supply plan attainment (How much of the supply plan did the plants produce?) and plant plan attainment (Did the plants make what they said they would make?) play a key role in determining OTIF. On the other hand, schedule attainment measures how many times the plant attained its target level of production within the set time. These key metrics determine the plant’s production accuracy, and predicting this helps to arrive at an agreeable OTIF % with the customers.
2 B. Carrier and logistic delays:
Carrier delays directly impact the OTIF metric, unlike the inventory, demand planning models, and plan attainment KPIs. SupplyChainDive.com says the most common causes for OTIF misses are pick-and-pack mistakes, transportation delays, and communication issues. Transportation delays are, perhaps, the most challenging supply chain risks to prevent. Therefore, it is critical to have a model that can score suppliers based on their performance and pick the right supplier for transport at the right time. Historical data from suppliers can be used to develop a machine learning model that can score suppliers based on various metrics. The key drivers from the model can be used to build a supplier scorecard that will enable CPG companies to track the performance and quality of the suppliers and choose the right suppliers for the shipment.
3 A. Sales Order Management (SOM) delays:
Although this contributes to a tiny portion of OTIF miss, managing the sales order is probably the low-hanging fruit to get. Predicting delays in sales order management can be achieved with simple KPIs such as existing purchase orders on hand, inventory on hand for specific SKUs, etc.
3 B. On-shelf and on-time availability:
Finally, it all boils down to predicting on-time, in-full availability of products for our customers. Again, this prediction can be made based on historical data of inventory, shipment accuracy, carrier delays, etc., of the SKUs. This can also be used to understand the features that lead to low OTIF% for actionable insights.
Conclusion
A supply chain toolkit with a 360° view of the supply chain that offers end-to-end visibility becomes the need of the hour. This toolkit would include tracking current and historical OTIF metrics, root causing from a retrospection standpoint, predictive capabilities or an early warning system that identifies upstream events, scenario planning tool that enables planners to modify the lead time, service levels, and other parameters to understand the impact on OTIF. Despite the disruption and heightened uncertainty in the current COVID environment, leveraging AI and advanced analytics is the only way to prevail in the turbulent new industry and ensure your order delivery performance is high.
References
https://www.invespcro.com/blog/same-day-delivery/
https://www.mckinsey.com/business-functions/operations/our-insights/defining-on-time-in-full-in-the-consumer-sector