Author: Natarajan Manivasagan
For cricket fans, it will be impossible to forget India’s incredible victory over Australia in the Border-Gavaskar Trophy 2020-2021.

The riveting competition was a delight for lovers of the sport. However, in this modern era of data-driven systems, a good game of cricket will take into account analytics in addition to scoreboards and umpire calls
Sports analytics has proved to be a gamechanger – there’s no other way to put it. In the past, decisions were based on ‘gut feeling’ or adherence to traditions, but not anymore. DDDM, or data-driven decision making, is a concept widely used now, wherein, before taking a decision, there must be strong data evidence to back one’s motives. Using analytics in sports directly impacts strategic decision-making that can easily change the outcome of the match.
Cricket analytics also provides interesting insights into the game. Cricket is a game of numbers – the matches won by a team, runs scored by a batsman, wickets taken by a bowler, and the difference in the performance of batting/bowling determines the winner of the match. Let’s decode the Border-Gavaskar Test series from an analytical point of view to find hidden insights and various attributes that drive one team’s success over the other.
Collecting the data
Capturing the right data is essential for greater insight. Data collection, sorting, and preparation is an integral part of any analysis. In our case, we collected data of the 4-match test series, ball-by-ball, on a spreadsheet. We identified the prominent attributes or combinations of attributes that play major roles in determining the result of the match. The available dataset contains both influencing and non-influencing factors. We tried to collect as much information as possible, however, some important metrics, such as missed opportunities, were not captured.
Practices from the Past
Before bringing analytics into the game, a strategy would be framed by the captain/management using existing data and experience of playing in a particular venue or against a particular team. This was more or less based on trial-and-error – sometimes, they got the desired result, but most often, their strategy would fail. There were no proper rules or guidelines to store data about a pitch, climatic conditions, ground dimensions, and stats of a particular player. Even if they had some useful data, its full potential would never be recognized or utilized.
Tools Used
Over the years, Python and Excel have been primarily used to process data. Few data sets have been analyzed using the business analysis application Power BI.Using data analytics software can provide better visualization and insight.
Analysis of Data
In this phase, we analyze the key attributes and how these impact the match. Apart from finding out the result of the match, analytics can provide a description of the important metrics. Let’s go step-by-step to have a better understanding.
I. Session Performance
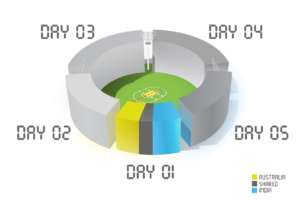
A Test match will be played for a maximum of five days, with each day dissected into three sessions of a maximum of 30 overs. For a team to be successful, they have to play to their full potential in each session. Every session is very crucial – even a single session can tilt the game’s balance.
Example: In the 1st Test match, India had the upper hand with a first-innings lead of 50-odd runs, but they collapsed in their second innings (single session 22 overs), which made Australia the favorites.
Let us derive an analytical method to determine the winner of the session, which can predict which team is likely to be more successful. The winner of the session can be the batting team or the bowling team or it can be shared between the two based on their performance.
Batting team’s session: When the team batting scores runs without losing any wickets or losing minimum wickets, the session belongs to them.
Example: In Day 5 of the 4th Test match, all sessions belonged to India, and they won the Test match by scoring 146 runs in the last session, losing only four wickets.
Bowling team’s session: When the bowling team bags multiple wickets in a quick span of time or restricts the batting team from scoring quick runs, the session belongs to them.
Example: In India’s second innings of the 1st Test match, Australia took eight wickets within the first 15 overs of Day 3.
Shared session: If the batting and the bowling teams perform equally in a session, it belongs to both teams.
Example: During the first session of Day 2 of the 1st Test match, Australia took India’s last four wickets for 120 runs, and once they came to bat, they lost their first two wickets for 35 runs. So, both teams performed equally.
Now, the crucial question is what are the attributes and how can they be used?
The session winner will be predominantly ascertained by the bowling/batting performance of the team, which involves keeping a record of the number of balls bowled during the session. In a single session, both the teams may have batted, so calculate who has won using the batting/ bowling performance and the innings which was played for a longer duration (more balls played/bowled). Runs/wickets is the new measure introduced to analyze the performance of the team.
If
Runs/Wicket > 30 – then the batting team has performed well by scoring more runs and losing few or no wickets.
30> Runs/Wicket > 25 – then the batting and bowling teams have performed equally.
Runs/Wicket < 20 – then the session belongs to the bowling team.
Please find a sample below of how the session winner is calculated from the above-mentioned attributes.
For easy understanding, please refer to the dataset available here – Dataset
F: Batting_Team, G: Bowling_Team, H: Total_Runs, I: Wickets_Cnt, J: Ball_Cnt
Session result was calculated by using the below formula: IF(J14>=0,(IF(J14>=90,IFERROR(IF((H14/I14)>30,F14,(IF((H14/I14)>=25,”Shared”,G14))),F14),(IF((I14>=3),G14,”Balls Bowled < 90″)))),”Rain”)
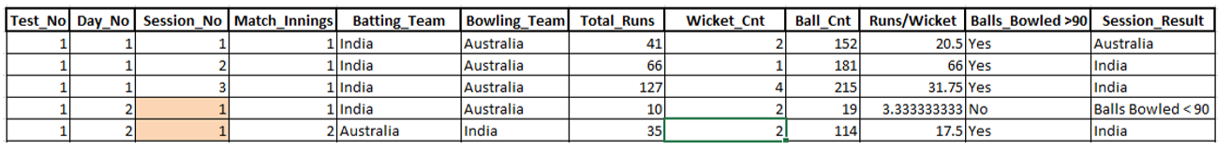
We have calculated the session result for all the played sessions. Now we have to calculate the performance stats of the teams per match.
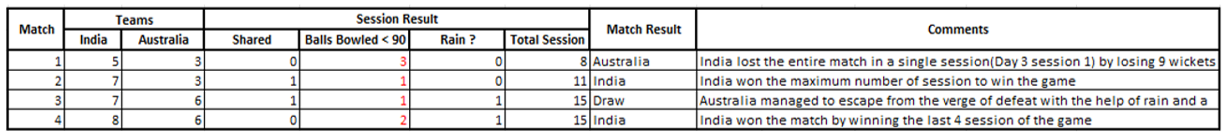
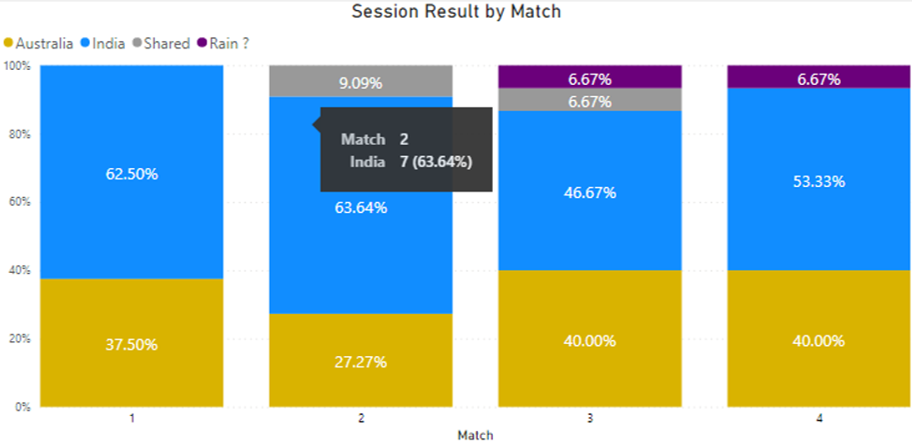
From the analysis, it’s evident that the team that wins the maximum number of sessions wins the match.
The first match is an exception, where India lost in a single session.
The second match was completely dominated by India- it won double the number of sessions as Australia.
The third match was a close call for India, as rain and the shared sessions helped Australia in reaching a draw.
In the fourth match, India dominated Australia in the last four sessions to win the match.
II. Batting Performance:
Each cricket match is held together by three key pillars: batting, bowling, and fielding. In this section, we will discuss the batting performance in detail.
Batting tactics and strategy vary depending on the type of match being played, as well as the current state of the match. The main concerns for the batting team are to not lose their wickets and to score as many runs as quickly as possible. These objectives generally conflict – to score quickly, risky shots must be played, increasing the chances of getting out. While the batman’s safest choice is to play a careful, wicket-guarding stroke, this may not yield any runs at all.
Based on need, batsmen may abandon attempts at scoring runs in an effort to preserve their wickets, or, may attempt to score runs as quickly as possible with little concern for the possibility of being dismissed.
Runs Scored:
India and Australia performed equally well, by scoring almost an equal number of runs throughout the series. The above stats can be easily visualized if we break down the number of runs scored in each match by the teams.
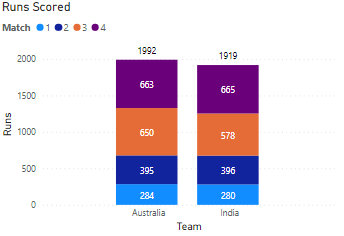
The total difference between runs scored by the teams is only 73. The main contributor to that difference is the third game.
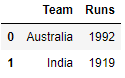
Let’s break down the runs scored by batting positions to get more clarity on the performance. It’s evident that the tailenders of Australia have scored more runs than the Indians, which gave them an added advantage. India’s middle-order batsmen (4,5,6,7) performed exceptionally well, and top-order batsmen (1,2,3) of both the teams performed equally.
Partnership:
Behind every top-class team, there is a top-class partnership. Batting in a partnership is an important skill and is crucial for the batting side to succeed. Even a single good partnership can tilt the momentum of the game.
Example: In India’s second innings of the 4th Test match, the partnerships between Gill & Pujara (114) and Pant & Sunder (53) helped India win.
Few good partnerships can win a match for a team. India capitalized by building key partnerships in crucial moments of the match.
Throughout the series, India managed to build an equal/higher number of partnerships than Australia in most of the matches. Except matches 1 and 3, India won the rest.
Now, let’s break down the existing results by innings, runs, and pairs to get more clarity on this.
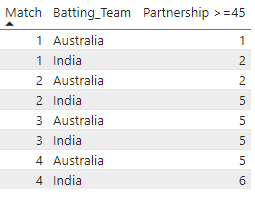
In the first match, Indian batsmen constructed two 50+ partnerships, whereas Australians managed to build only one 40+ partnership. , Yet, India lost the match due to their poor performance in their second innings.
In the second match, Indians stitched four 40+ and one 100+ partnership, and Australia constructed only two 40+ partnerships. This difference helped India dominate Australia.
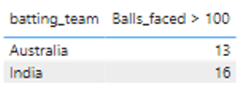
During the third test match, the Australians constructed four 100+ and one 40+ partnership. Indians managed to build one 100+ and four 40+ partnerships, which evened out the advantage for both teams.
In the final test match, Indians built two 100+ and four 40+ partnerships, whereas Australia managed to build one 100+ and four 40+ partnerships. One additional partnership helped India get across the line.
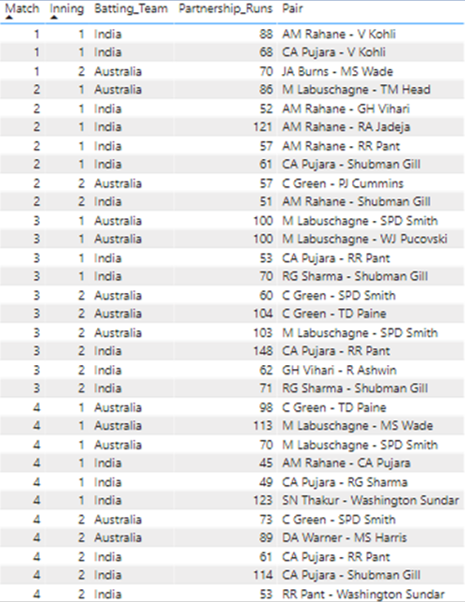
Balls Faced:
Runs scored along with the number of balls utilized determines the success of a partnership. If the partnership was built to save a team from defeat, then scoring runs is not important, as the batsman has to defend each ball and try to play as long as possible without losing wickets.
If the partnership was established to get quick runs, then the batsman will play aggressive shots without minding his wicket.
Let’s look at the number of instances when a pair played more than 100 balls. Indian batsmen performed well by playing longer innings and facing a greater number of balls – this helped them to both attack and defend.
Example: In the second innings of the 3rd Test match, Indian batsmen performed well by playing out nearly 17 + overs to draw the match.
III. Bowling Performance:
In cricket, the ultimate aim of the fielding side is to restrict the opponent from scoring high, and here, the bowlers play a prominent role in achieving this feat.
Bowlers have different strategies to accomplish the task, with taking wickets as quickly as possible being the primary one. The second strategy is bringing down the run rate. Depending upon the situation, these two strategies are weighed out.
In fact, in most forms of cricket, the dual aim of the fielding side is targeted concurrently, as the achievement of one aim tends to have a positive effect upon the other. Taking regular wickets will remove the better batsmen from the crease, typically leading to a slowing of the scoring rate. Conversely, slowing the scoring rate can put additional pressure on the batsmen and force them into taking more risks, which will often lead to wickets.
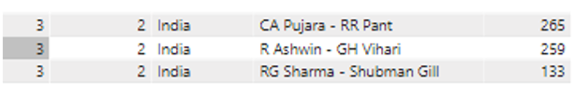
Strike Rate (Wickets per ball):
An important metric to capture bowling performance is the strike rate, and it is calculated using the below formula.
Strike rate = (# of balls bowled)/(# of wickets taken)
The strike rate indicates the number of balls a bowler has bowled to pick up a wicket. Ideally, a bowler should maintain the strike rate as low as possible – lower the strike rate, fewer the balls bowled to pick up a wicket.
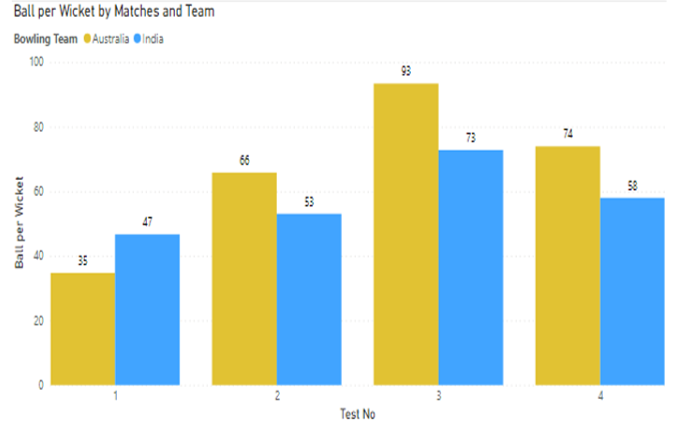
In the Border-Gavaskar series, Indian bowlers performed exceptionally well. They utilized the pitch and other conditions to their advantage and bagged more wickets by allowing a minimum number of runs. If we break down the bowling performance for each match by the number of balls bowled to wickets taken, it’s evident that the strike rate of the Indian bowlers is far lower than the Australian bowlers.
In the 1st Test, Australia performed well in the second innings, so they have a lower strike rate than India. In matches 2,3 and 4, Indian bowlers showed a clinical performance which helped them to get a lower strike rate than Australia.
The difference between the strike rates is almost 20+ balls, which indicates how well the Indian bowlers performed on the same pitch where Australians struggled to perform
 IV. Optimum usage of DRS
DRS – Decision Review System – is a technology-based system used to challenge the on-field umpire’s call.
Whenever DRS is opted for by a team, the third umpire will evaluate the on-field decision by using enhanced technology features, such as video footage (frame slicing), Snickometer, ball tracking, and hotspot.
Players feel secure in the presence of DRS, as it gives them the power to challenge the umpire’s decision. If a review is available and a player opts for it, the umpire’s decision can be reversed in the event that he is wrong. However, if the decision isn’t faulty, the team loses its review.
With LBW decisions, the case is different. If either the impact or the zone where the ball is pitched, or the projected ball path towards the stumps is an umpire’s call, their decision will stay. However, the teams won’t lose out on their review if the umpire’s call matches with the DRS outcome.
In this Test series, there were a number of occasions where the DRS shifted the balance. Our primary aim here is to identify the team that has used DRS correctly without losing the review at any cost.
Let’s look at our data set to identify the fields which can be used at the match level.
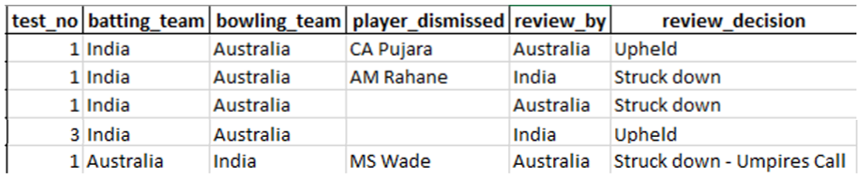
Example:
Upheld – Bowling Positive effect: In the first row, the review was called by the Australian team (bowling) against the umpire’s decision (not out). Upon review, the third umpire’s decision was changed to ‘out’.
Struck down – Bowling Negative effect: In the third row, the review was called by the Australian team (bowling) against the umpire’s decision (not out). However, post the review process, the third umpire’s decision was upheld, and Australia lost the review.
Upheld – Batting Positive effect: In the fourth row, the review was called by the Indian team (batting) against the umpire’s decision (out). Post the review process, the decision was changed to ‘not out’ by the third umpire.
Struck down – Batting Negative effect: In the second row, the review was called by the Indian team (batting) against the umpire’s decision (out). Post the review process, the umpire’s call was confirmed as ‘not out’, so India lost the review.
Struck down/Upheld – umpire’s call Nil effect: Some times, the review and the umpire’s call are in alignment, so neither team loses the review.
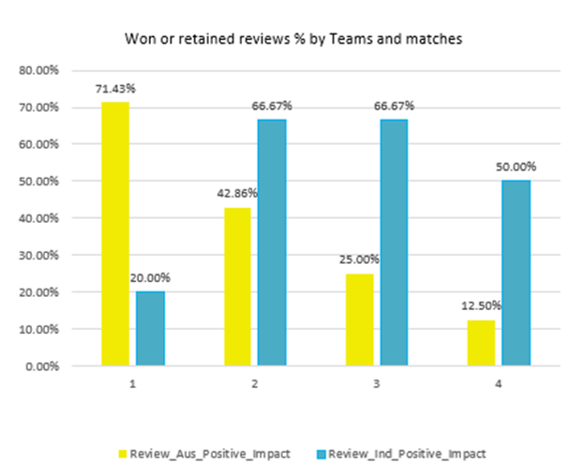
Let’s look at how effectively Australia used the review system by deriving a metric that takes account of the successful reviews (reviews won + umpire calls) and the ones that are lost.
Review_Gooduse% = (Review_Won+Review_Ump)/(Review_opted)
During the start of the series, Australia used the DRS system well, but over time, they were unsuccessful. It’s visible from the tabulation that the % effective usage of review by Australia started dipping from 71.43% to 12.50%.
Now, in a similar way, we will derive the metric for India.
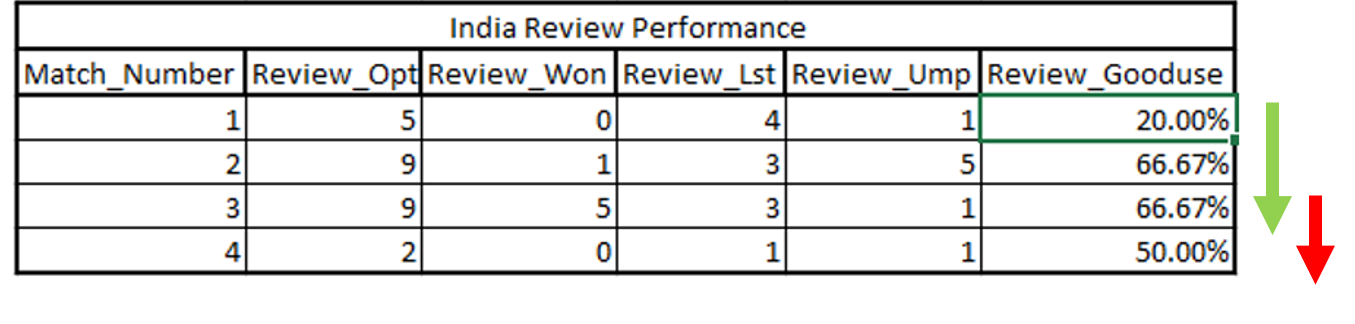 India didn’t start well, but they matured during the course of the series. The percentage of effective usage of review by India rose from 20% to 66%, and they managed to maintain it at 50% or higher.
India did a better job with DRS by not claiming the instances which they weren’t sure about. In matches 3 and 4, they lost only 1/3 of the claimed reviews.
But on the other side, Australia had lost 1/2 of the claimed reviews in matches 2,3, and 4. In matches 3 and 4, they didn’t win a single review but managed to take advantage of the umpire’s call.
India managed to draw the 3rd test match by effectively using the DRS system. Vihari was called out by the on-field umpire, but he overpowered the decision by using the DRS system.
Takeaway
Analytics plays a prominent role in modern-day sports, which we explored using a sample case. In the above descriptive analysis, we have mentioned the different factors that have helped a team be successful. We don’t have any limit in analyzing sports data – the more options, the more insights into a game. The above metrics complement each other in deciding which team will be more successful.