As organizations continue to grow in scale and manage large volumes of data, Python and Machine Learning libraries play a crucial role in performing in-depth analyses on large and unstructured data. But to help businesses make data-driven decisions, that data needs to tell the right data story in the right way. That’s where a visualization tool like Tableau comes in.
Tableau and Python are the most popular tools that aid in maximizing the outcomes of data analytics & AI. Python is an Open-Source platform while Tableau is a paid tool – and they serve different purposes. For instance, Python can be used for data visualization and data processing, while Tableau can be leveraged to create different charts to analyze and represent data.
Why integrating Tableau and Python is crucial
When Tableau and Python are integrated, you can extract smarter analytics – leading to better results. Here’s what we mean.
First, Tableau calculates the fields, which are then defined using Python. This allows you to harness the capability of various libraries and functions – seamlessly from the visualizations presented by Tableau. You can also customize the calculated fields in Tableau – using new models to implement features like Machine Learning, predictive analytics, sentimental analytics, and time series forecasting.
You can do this through TabPy, an API that enables the evaluation of Python code from within a Tableau workbook.
Let’s go through the step-by-step process.
Four steps involved in integrating Tableau and Python
1. Check the prerequisites
a. Python IDE to be installed in your system – preferably the Anaconda Navigator
b. Tableau Desktop to be installed on the machine.
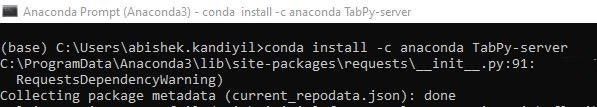
2. Download TabPy Server – an API allowing the execution of Python codes from a Tableau workbook. Now, install TabPy by:
a. Opening an Anaconda command prompt (Advised to use the “Run as Administrator” option)
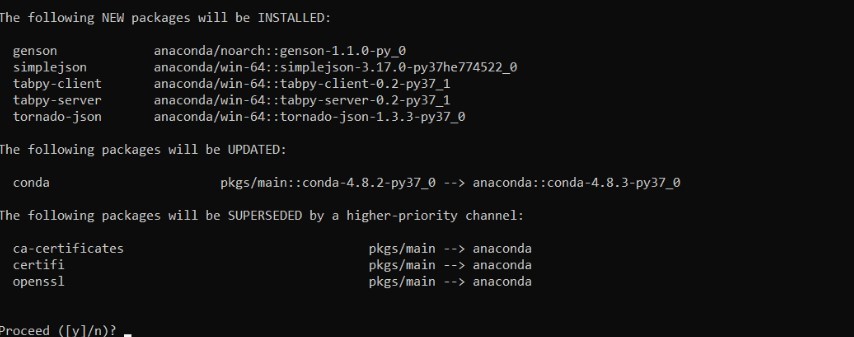
b. Running conda install -c anaconda TabPy-server command in the command prompt
c. Inputting ‘Y’ once the download is completed and you get the Yes/No prompt to proceed
d. Once completed, change the root directory to the path where the server is installed by running the below command in Anaconda prompt
Cd C:\Users\*your username*\Anaconda3\pkgs\tabpy-server-0.2-py37_1\Lib\site-packages\tabpy_server
3. Start the server using the startup.bat command. After running the startup command, the server will be started, and the port number will be visible on the screen. Now, the server is ready to connect with Tableau. The rest of the operations would have to be carried out inside the tableau desktop.
4. Open the Tableau Desktop and follow the below steps:
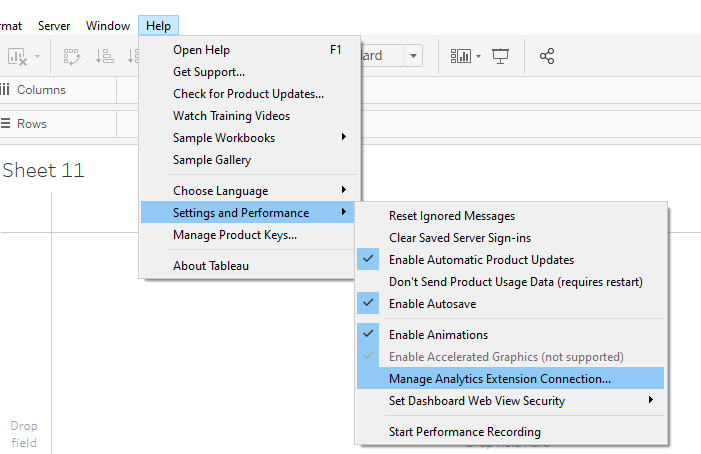
a. Go to the Help menu
b. Choose settings and performance
c. Choose Manage Analytics Extension Connection
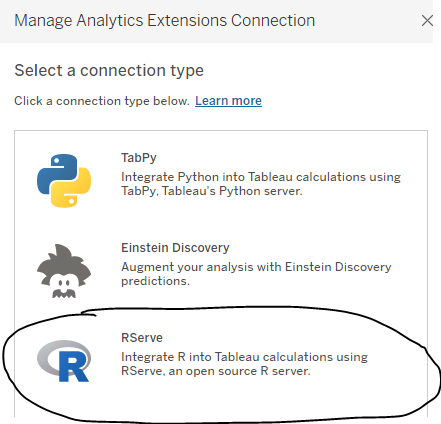
d. Select TabPy from the list
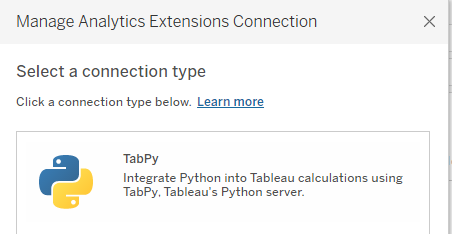
e. Give the localhost and port number shown in the command prompt (Usually 9004) and test the connection
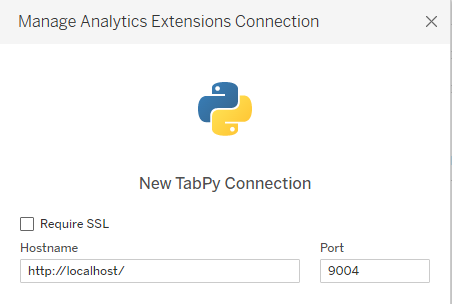
f. Once the connection is successful, click on the OK button to approve the external connection.
Now, let us also see how you can integrate Tableau and R.
How to integrate Tableau and R
Like Python, you can also integrate R – a widely-used Open-Source programming language – with Tableau. Equipped with many packages, libraries, and modules, R is predominantly used for statistical analysis, similar to Python.
You can use the ‘RServe’ package to establish the connectivity before using the resources in R by using a calculated field to call the R engine. The values will be passed from Tableau as an array to R, which uses this for the calculations and analysis. Once the calculations are made, R will return the results to Tableau – enabling you to visualize for better insights.
Steps to establish the connectivity and do the analysis
1. Download and install R in your system.
2. Install the RServe package by running the below command:
install.packages(“Rserve”)
You may be prompted to select a CRAN mirror, as R advises selecting the mirror closest to your location to minimize the load.
3. Run the package in R post-installation – like below:
RServe::Rserve()
4. As the above step should start the server, you can go to Tableau and connect with R.
5. Open the Tableau Desktop and follow the below steps (similar to Python-Tableau connectivity):
a. Go to the Help menu
b. Choose settings and performance
c. Choose Manage Analytics Extension Connection
6. Now, instead of TabPy – select RServe.
7. Specify localhost and give port as 6311 and the test connection. If the connection is successful, click OK.
There are a variety of functions used in the Tableau calculated field after the integration with R. These functions will define the output format of the function result. You can provide the calculation with the arguments. These functions include:
a) SCRIPT_REAL: Implies that the output will be a real number
b) SCRIPT_INT: Implies that the output will be an integer
c) SCRIPT_STR: Implies that the output will be a string
d) SCRIPT_BOOL: Implies that the output will be a Boolean value.
The skeleton of the calculation is as below:
script_*(‘R Code’, arg1, arg2…)
=
As with any technology that sees exponential growth, data analytics and AI have their fair share of tools like Python, R, and Tableau to meet industry dynamics and unique business requirements. A specialist with expertise in large-scale data analytics and AI projects can help in integrating these two and combining their strengths to solve various use cases. And in doing so, businesses can operationalize a cost-effective yet powerful solution to turn datasets into data insights.