In organizations where data-driven solutions are valued, Data democratization is becoming a necessity.
Data virtualization and Data federation software act as enablers of Data democratization by eliminating an organization’s data silos and making the data accessible through virtual storage mediums.
Access to data at the right time and in the right manner is crucial for making data-driven decisions. However, classifying the data and granting relevant access to varied users has always been a challenge.
With traditional BI implementations, the responsibility for report development rests primarily on IT teams. As the number of stakeholders and the demand for accessible data increase, Self-Service BI can be regarded as a form of Data Democratization, equipping more business users to work on their own through monitored access profiles and data accessibility, easing the burden off single teams.
Self-Service BI enables business users to access and explore data by running their own queries, creating their own data visualizations, dashboards and reports, filtering, sorting, and analyzing data. The availability of online learning materials, self-paced learning, and access to resources has made it possible for users to feel comfortable using different data touchpoints and dashboards to make insightful decisions. Data democratization has ushered in a data-driven culture which means that access to data can now be shared by multiple stakeholders. All in all, we’re seeing improved communication channels and better collaboration.
Setting up a Self-Service BI
At Tiger Analytics, we partnered with a large-scale silicon component manufacturing company based out of the US, to implement a Self-Service BI solution.
The Higher-Order curated datasets that were built for self-service enabled tech-savvy business users to conduct ad-hoc analyses. This saved a lot of the time and effort that it would have taken them to build a traditional BI report/Dashboard. The users did not have to wait in a queue for their respective requirements, which also meant that they had access to the information they needed much earlier, enabling them to deliver quicker analysis and helping them generate reports faster.
The key advantage of this self-service analysis was that the business user could conduct ad-hoc analyses from time to time, focusing on their high-value priorities, and was now able to get faster results, on the go, rather than going through an entire report development life cycle.
Building a modern data platform that can handle data sources of variety and volume and that can support scalability and concurrency to manage business dynamics is of utmost importance.
While implementing a Self-Service BI within an organization, here are a few of our best practices that you can replicate:
- Provide proper business names for tables, columns, and measures
- Create a report catalog page for the users to find the reports and datasets
- Add a data dictionary page to include definitions of data elements in the report
- Build templates to create consistent report layouts by users
- Display only the relevant tables – Hide other config or supporting tables
- Build proper relationships between the tables since users can simply drag and drop fields across different tables.
- Add the description to tables and fields for better understanding
- Add required synonyms for the fields; if users use Q&A, then it will help them
- Establish a governance committee to enable self-service for required end users
- Create end-user training modules for effective use of self-service
- Self-service should be limited to only a specific set of users
- IT needs to monitor the self-service usage to avoid concurrency and performance issues
- Make tools available to the end users for self-service enablement
- Restrict publishing of ad-hoc reports in common workspaces
- IT to ensure infrastructure is scalable and efficient for Self-service and Reporting needs
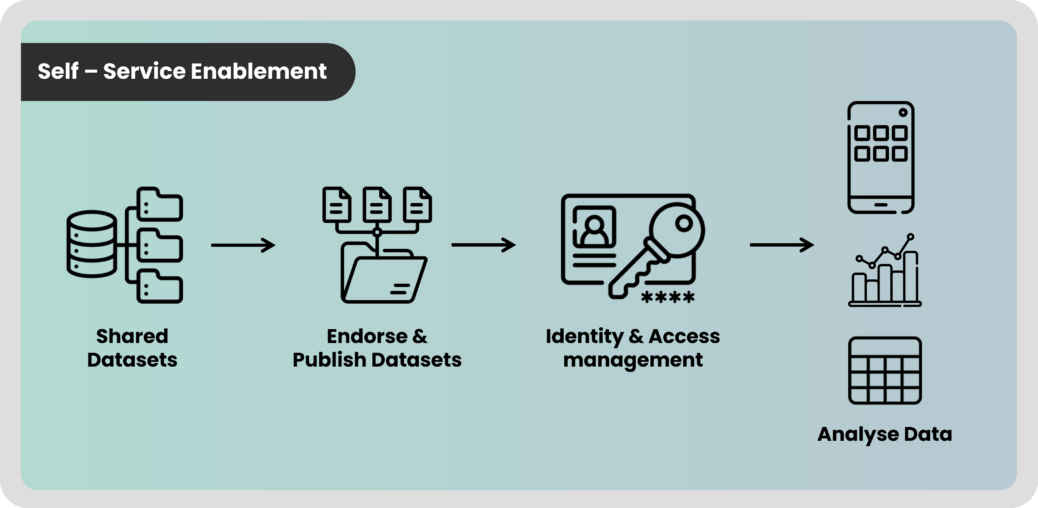
We’ve extracted and created shared datasets, created semantic layers on top of the data layer, and defined key data quality metrics, data management, access, and usage policies. The diagram below depicts various stages of the Self-Service BI life cycle.
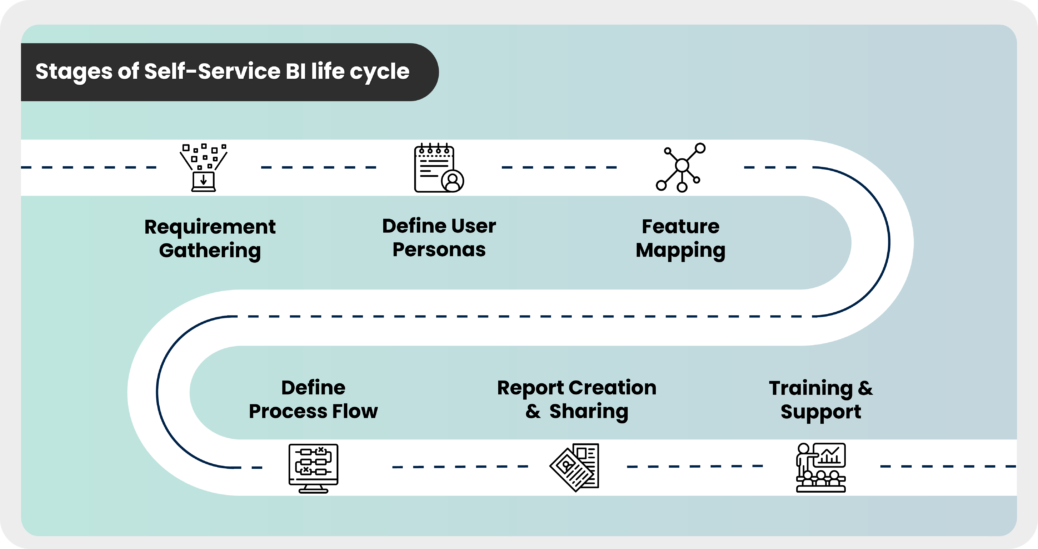
The requirement gathering is done at the ‘line of business’ level, unlike traditional BI, where it’s at the ‘report’ level. This enables multiple user personas to use the same shared datasets.
Self-Service User hierarchy
Once we have the baseline requirements, it is imperative to group users into multiple user personas based on their skills and requirements. This will help in creating different roles and defining access for each group.
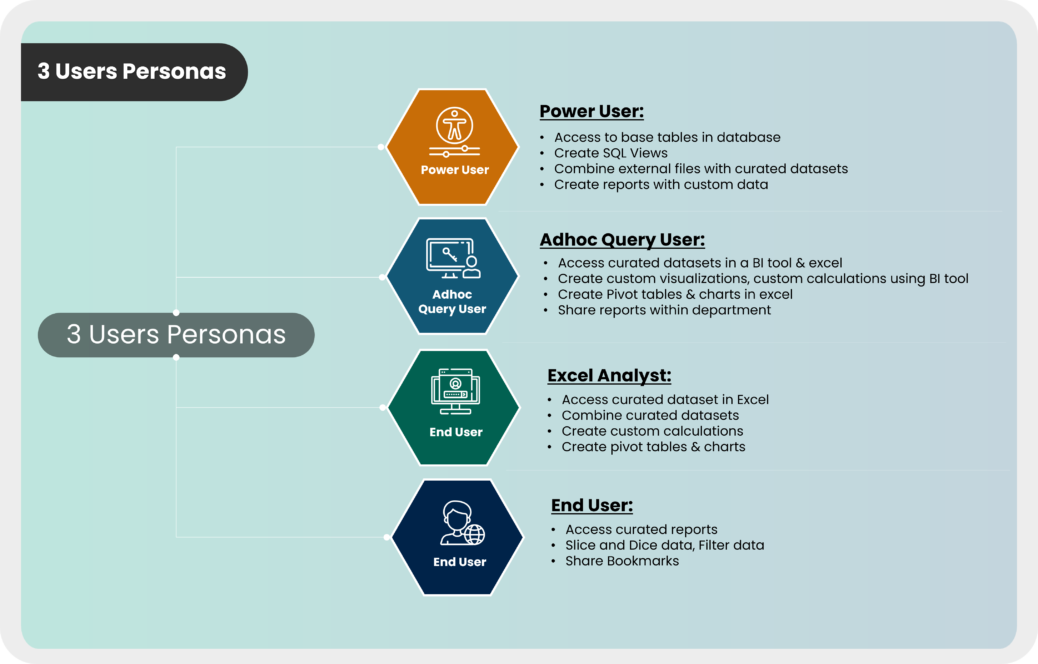
While working with our client, here’s how we segregated the users into four user personas.
1. Power User
The Power user is a technical user. They have access to the base tables in the database. Power users can create their own views by applying the filters on the tables/views in the database, and they know how to combine data from external files with the tables and create reports.
2. Ad-hoc query user
The Ad-hoc query user knows how to use Power BI. They can connect to curated datasets and create custom visualizations. They are also capable of creating custom calculations in Power BI and have the provision for sharing the report within their line of business.
3. Excel analyst
The Excel Analyst can connect to shared datasets in excel, create their own custom calculations in excel, and create pivot tables and charts in Excel.
4. End User
The End User has access to the Reports and Dashboards, can slice and dice data, filter data, and share bookmarks within the team.
Self-Service User journey and process flow
Here’s how we’ve mapped the available features and the users, as shown below:
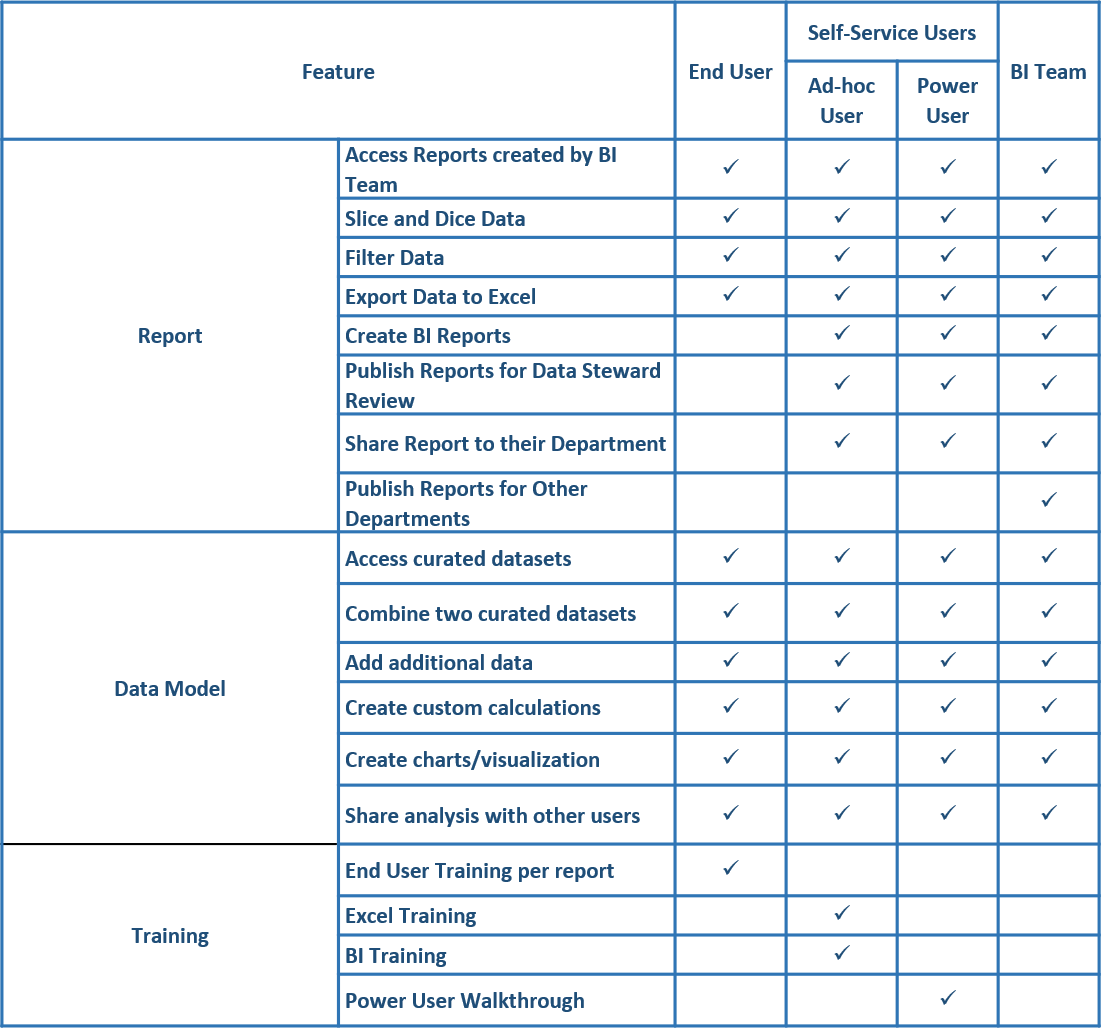
Once the users are defined, and the datasets are ready, a process flow needs to be defined to document the data access flow for the user. A report catalog page is created to organize all the available reports in various headers.
- A data dictionary page is created in each report for the users to comprehend the data elements in the report.
- User training sessions are set up for the Business users to train on report usability.
- User is assigned a Developer License on the access request.
- Users are allowed to review the catalog of shared reports and datasets.
- If the required dataset is available, the user can create a new report on top of the dataset and publish to the department portal and share it with their respective department.
- If the required dataset is not available, the user requests for the development and deployment of new datasets/reports which can be used by them.
- The user can either share a report at the department level or can create a report to be used at the organizational level and share it in the Enterprise Report portal.
There can be follow-ups to review the progress and share tips and tricks, BI best practices, and templates.
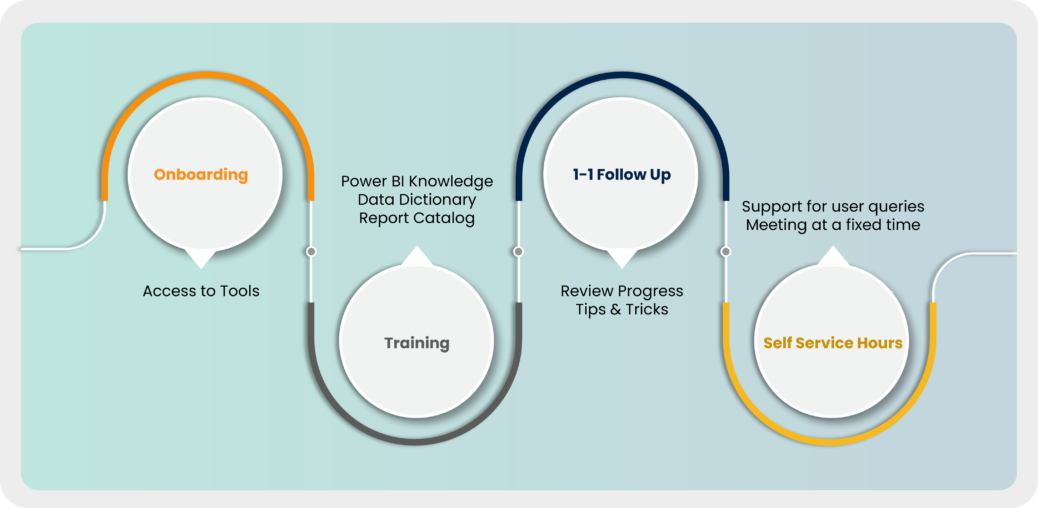
One of the most common challenges we’ve seen with Self-Service BI is the lack of adoption by business users. The users might have difficulty in understanding how to use a report or a shared dataset available to them or might create reports with inaccurate analytical results. To ease these issues, it’s a good practice to institute Self-Service Office Hours as a forum for self-service users where the BI team can help users to understand what data is available to them and how they can access It.
The members of the BI team could make themselves available to help or support business users on an ongoing basis and are available for centralized monitoring.
With this, users get their questions answered, and that helps bridge the data literacy gap. This effort also enables collaboration among different teams within the organization. The users can then hop in and hop out of the session as required.
The Road ahead…
Regardless of the size of the organization, data availability is not enough. That data needs to be accessible so that the leadership can use that information to derive useful insights and craft meaningful strategic interventions.
Self-Service BI implementation empowers employees by giving them access to data. And even with our clients, this has considerably reduced the cost of report development, fast-tracked data-driven decisions, and improved collaboration within the organization.
As organizations and their needs continue to evolve, so does their self-service journey, making data-driven insights the new normal.
Read our other articles on BI.