We know that BI Dashboards play a vital role in businesses across various sectors. They are a vital part of businesses that seek to exploit the data at hand and arrive at actionable insights. But the data that any business has access to, is constantly expanding with the advent of techs like Cloud and Big Data. Modern BI platforms like MS PowerBI, Tableau, Looker, Atscale that can handle such large volumes of data and arrive at insights are therefore a necessity.
Recently, at Tiger Analytics, we carried out a large-scale BI platform migration for a US-based Travel and Logistics company. Their legacy BI reports were migrated into modern Power BI dashboards with several key objectives in mind:
- Data modernization and availability of analytical infrastructure
- Platform and data migration to the cloud
- Self-service analytics
- High-end user experience
- New-agile BI tools capabilities on Artificial Intelligence (AI) or Machine learning (ML) to Natural Language Querying
Our customer opted for PowerBI as their BI tool of choice, due to better synergies with O365 and other Microsoft products.
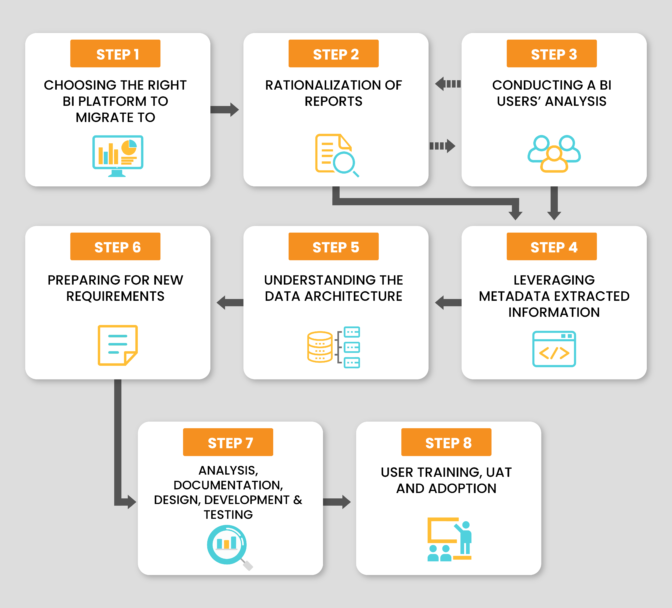
Regardless of what BI Platform you choose to migrate to, these 8 steps with ensure a highly effective, frictionless transition.

Step 1: Choosing the right BI Platform to Migrate to
Keep in mind these parameters while choosing the right BI platform
The platform best suited to your needs will:
- Have Repository Management, Data Discovery, Data Governance, SDK or extensions support, Data Preparation layer
- Also have Self-Service BI, Cloud BI, Mobile BI, Real-Time Analytics, Augmented Analytics, NLP, Embedded Analytics, and IoT Analytics
- Support Data Warehouse Modernization, Integrated Platforms for BI tools, and Apps integration
- Support most of the features in the existing platform and provide value for money
Step 2: Rationalizing the Reports
- Take an inventory of used and unused reports ( across a 6 or 12-month timeframe)
- Identify identical reports (both content and functionality-wise) for reusability
- Discuss with BSA/BA to finalize a list of dashboards with end users and prioritize them
- Finalize if code-freeze is required or limit activities in the legacy system
- Recommend new developments for the new BI platform
Step 3: Conducting a BI User’s Analysis
- Identify active and inactive users
- Identify the users’ reports’ usage patterns
- Understand the row-level/folder-level/LOB-level security setup
- Understand how BI users’ onboarding/offboarding takes place
- Check if an active directory is being used.
Step 4: Leveraging Metadata Extracted Information
- Data source types/connections, tables used in the dataset, calculated items in the dataset, dataset schedule
- Users, user groups, dashboards shared with, dashboards subscription list
Step 5: Understanding the Data Architecture
- Get a complete understanding of how the data architecture is set up
- Check if any recent data modernization was done and look for the availability of new sets of data
- Get an understanding of how data gets pushed to BI (if it is DW or Data Mart layer or others)
- Identify areas of improvement from legacy systems
Step 6: Preparing for New Requirements
- Understand customers’ security needs and their plans for implementation.
- Decide between rebuilding or redesigning, while considering how the timelines will get accordingly affected.
- Gather all customer expectations on what the new BI platform needs to achieve, evaluate its new features, and plan how you’d like to incorporate those.
Step 7: Analysis, Documentation, Design, Development, and Testing
- Document the dimensions and measures used in the selected dashboards to remove unwanted tables/views in datasets.
- This would also help to backtrack datasets, and dashboards based on a simple change in table level.
- BI platforms supporting ETL changes may differ, so data modelling needs to be planned accordingly.
- Collect commonly used calculated items from dashboards and bring them to the dataset level.
- Develop master templates and dashboards based on reusability.
- Use apple-to-apple comparison between the platforms for data validation.
- Test the performance of datasets and reports, user groups, email subscriptions, RLS, object level, device parity, and jobs scheduled as per the same time and time zone.
Step 8: User Training, UAT, and Adoption
- Facilitate user training in Page and Dashboards navigation, using Advanced Filtering, Emailing, and Exporting files to help increase the adoption of the new platforms.
- Help users get acquainted with the new BI platform and help them use it effectively. Educate them about the new features of the platform.
- Analyze the user adoption metrics, and check for challenges faced by users if user adoption numbers go down.
Once you’ve completed the BI Platform Migration process, you’ll need to keep a check on a few things to make sure that there are no implementation bottle-necks down the road:
» Rolling out migrated reports to bulk users and granting access to users should be handled carefully. Log-in failures for new users, inability to access all the dashboards and other such issues can be preemptively dealt with if planned well.
» Watch out for challenges in the adoption of the new BI platform.
» Check if BI users have the required access – utilize the power of role-based security on BI tools to achieve this
» Changes made without freezing code in the previous BI platform could lead to issues.
» Users may take time to learn the new platform.
As businesses continue to evolve and adapt to their industry demands, the need to make data-driven decisions will continue to grow. A well-implemented and hassle-free BI tool migration will ensure that the users are equipped with the right insights they need to drive their business strategy.


